An air leak you can't see or hear quietly adds to the electricity bill all year round. Nearly a third of the compressed air produced in industrial facilities is estimated to be lost to leaks.
Leak Cost Example
3mm hole, 6 bar → thousands in yearly electricity cost
1. The Real Cost of a Leak
A small hissing sound is actually a hidden, constantly-running load, since the compressor keeps working overtime to compensate for the loss.
2. Detection Methods
| Method | Cost | Speed | Suitable Scale |
|---|
| Soap test | Very low | Slow | Small line, single point |
| Ultrasonic detector | Medium | Fast, remote | Large plant, noisy environment |
- Soap Test: apply soapy water to suspect points and watch for bubbles; effective for small leaks
- Ultrasonic Detector: picks up turbulence's high frequency, detects from meters away without stopping production
- Periodic Scanning: a program repeated every three months prevents leaks from accumulating
"Logging the repair date and estimated cost of every detected leak is the easiest way to show management the investment's payoff in concrete numbers."
— BRS PROSES Engineering Team
3. Most Common Leak Points and BRS Proses Support
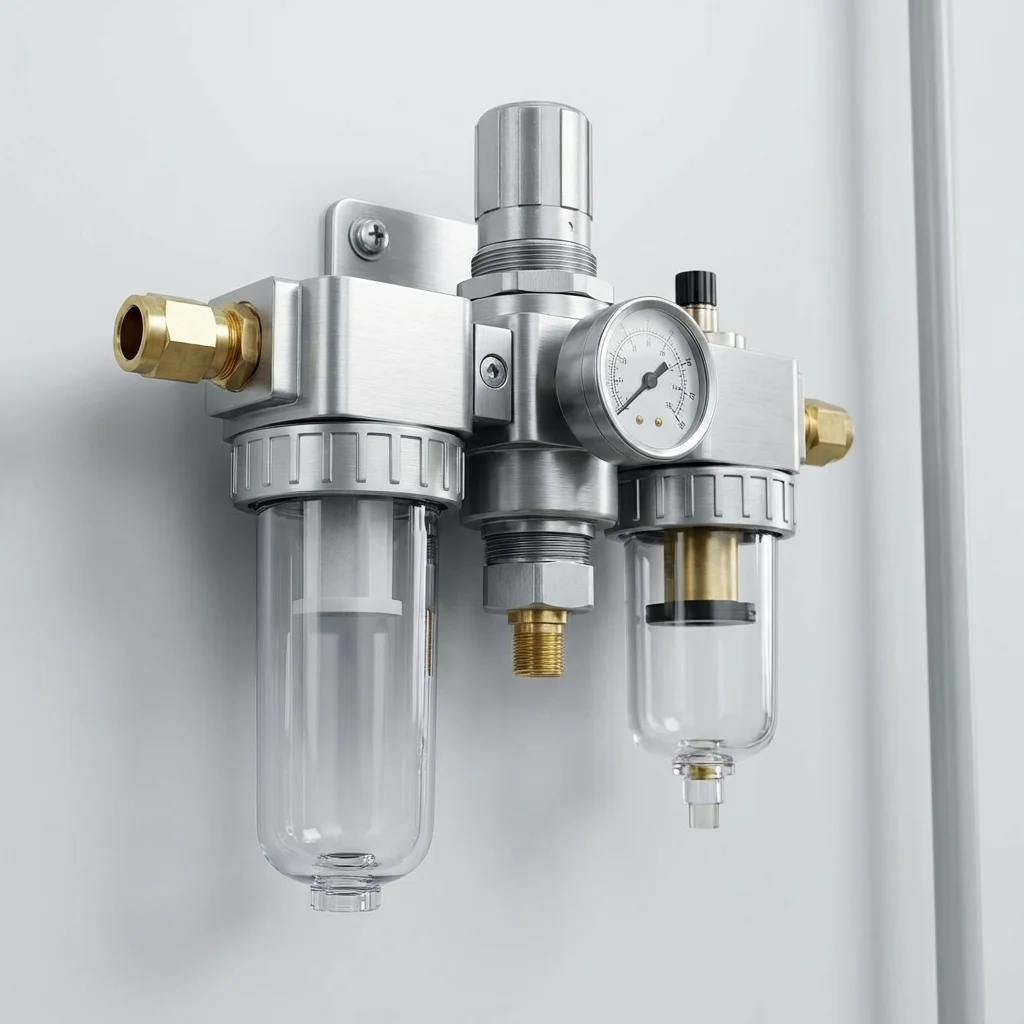
Hose connections, quick couplers, and old cylinder seals are the most common leak points:
- Ultrasonic leak scanning
- Leak cost reporting
- Periodic leak detection program setup
- Repair and follow-up plan
6. Ultrasonic Heterodyne Sensor Physics (38–42 kHz)
Human hearing cannot detect high-frequency compressed air leaks amid the background din of an operating stamping or packaging plant. As pressurized air (6–7 bar) escapes through a micro-fissure or worn fitting into ambient air (1 bar), sonic velocities generate turbulent eddies that emit acoustic energy predominantly centered between 38 kHz and 42 kHz.
Industrial ultrasonic leak detectors capture this acoustic spectrum via directional parabolic microphones and heterodyne (frequency shift) the signal into audible headphone tones while simultaneously processing signal intensity into standardized decibel levels ($ ext{dB}mu ext{V}$).
7. Quantitative Economics of Compressed Air Leaks (ISO 11011 Audits)
Compressed air leakage flow rate through an equivalent circular orifice is governed by the Fliegner choked flow equation:
Q = C_d \cdot A \cdot P_1 \cdot \sqrt{\frac{\gamma}{R \cdot T_1} \cdot \left(\frac{2}{\gamma + 1}\right)^{\frac{\gamma + 1}{\gamma - 1}}} \quad [kg/s]
| Orifice Diameter |
Air Leakage @ 6.0 Bar |
Electrical Power Waste |
Annual Financial Loss (8,000 hrs @ €0.20/kWh) |
| 1.0 mm (Pin hole) |
74 Nl/min (1.23 L/s) |
0.55 kW |
€880 / year |
| 3.0 mm (Loose fitting) |
660 Nl/min (11.0 L/s) |
4.95 kW |
€7,920 / year |
| 5.0 mm (Ruptured hose) |
1,840 Nl/min (30.7 L/s) |
13.8 kW |
€22,080 / year |
Acoustic Ultrasonic Leak Auditing & ISO 50001 Energy Management
In typical manufacturing plants without systematic leak management, between 20% and 35% of total compressed air generation is lost to piping orifice leaks, leaking push-in fittings, worn quick-disconnect couplers, and damaged FRL drains. Because compressed air generation requires approximately 7–8 kW of electrical energy per 1 m³/min at 7 bar, every millimeter of leak aperture represents substantial financial waste.
1. Ultrasonic Detection Physics (38 kHz - 42 kHz)
When pressurized gas escapes through a small orifice into atmospheric pressure, turbulent friction generates high-frequency ultrasonic waves centered around 40 kHz. Ultrasonic acoustic camera imagers isolate this frequency band from loud factory background noise (which primarily resides below 10 kHz), pinpointing exact leak coordinates onto a visual screen even from distances of up to 25 meters.
| Orifice Diameter |
Air Flow Rate (at 6.0 bar) |
Equivalent Power Loss |
Annual Cost (@ €0.18/kWh, 6000h) |
| 1.0 mm |
75 Nl/min (0.075 m³/min) |
0.6 kW |
€ 648 / year |
| 3.0 mm |
670 Nl/min (0.67 m³/min) |
5.1 kW |
€ 5,508 / year |
| 5.0 mm |
1,860 Nl/min (1.86 m³/min) |
14.2 kW |
€ 15,336 / year |
Technical Field Inspection & Commissioning Protocol
Prior to signing off on any fluid power retrofit, system upgrade, or routine component overhaul, technical commissioning engineers must rigorously complete the following verification procedures to ensure full compliance with ISO machinery safety standards:
- Static Hydrostatic / Pneumatic Pressure Proof Test: Pressurize circuit to 1.5× maximum design working pressure for 15 minutes, inspecting all welded flanges and fittings for micro-weeping.
- Contamination & Fluid Particle Verification: Draw dynamic fluid samples under working temperature and confirm ISO 4406 cleanliness classes (or ISO 8573-1 air dew point classes) before activating sensitive proportional spool valves.
- Thermal Baseline Profiling: Record continuous thermal infrared scans of pump casings, valve manifold manifolds, and accumulator bodies across 4 hours of full-load production cycles to confirm proper thermal dissipation.
- Failsafe & Emergency De-energization: Verify manual LOTO isolation valves, dump valves, and accumulator vent blocks discharge trapped hydraulic/pneumatic kinetic energy to 0 bar within 2.0 seconds of emergency e-stop triggering.